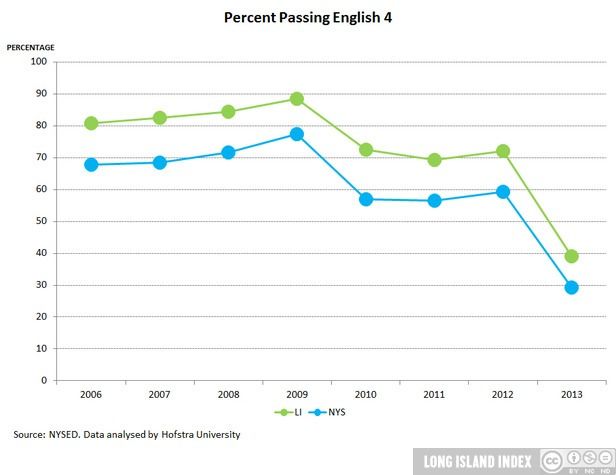
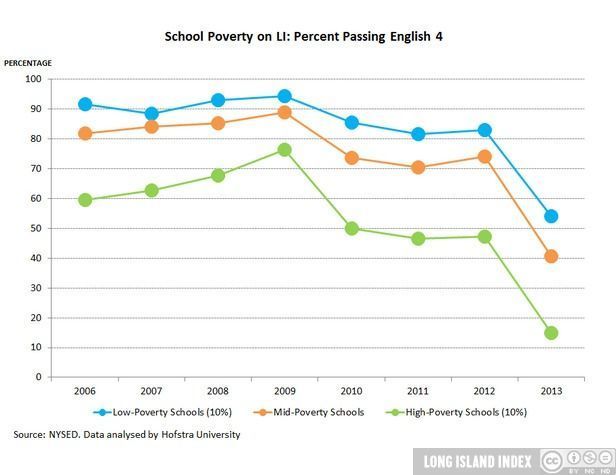
Overall Long Island schools’ 4th Grade English Language Arts performance results exceed New York State. The gap between low-poverty and high-poverty schools, narrowed until 2009, but has since increased.
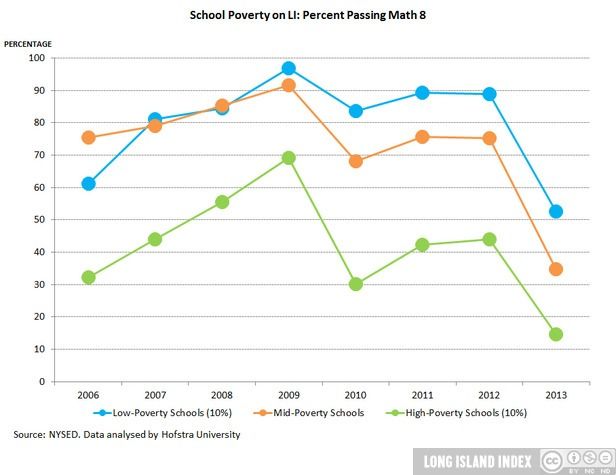
8th Grade Math results continue to exceed New York State. Performance for high-poverty schools improved until 2009. Dramatic declines were seen in 2013.
Why is this important?
According to the NYS Education Department, the Grade 4 English Language Arts (ELA) exam and the Grade 8 Mathematics exam reflect benchmarks that identify those students who are on target to pass, and those who may have difficulty passing, the English and Mathematics Regents Exams when they reach high school. These are part of the requirements for graduating with NYS’ “Regents Diploma.”
How are we doing?
Schools are ultimately about student performance and below we provide several indicators that measure performance throughout the educational queue, including 4th grade English and math, 8th grade English and math, and a composite measure of “college readiness” which reflects student scores across numerous high school Regent’s examinations.
The picture is further complicated by NYS’s recent decisions to increase the raw score that would indicate “passing” on the various tests, and then to adopt the “Common Core” academic standards. The Common Core is a national curriculum and a series of corresponding educational benchmarks that have been agreed upon by most of the American states. As NYS implements the Common Core, comparisons of student performance (on both raw scores and passing rates) across years become invalid because one year’s test in a given grade and subject might not be measuring the same skills as the next year’s test. Given these changes—NY’s move to the Common Core and varying cut scores by year—we see substantial fluctuations in the academic performance measures across years that are not reflective of differences in learning; but instead, they are reflections of changes in curricula and tests.
These curricular and cut score changes present problems for comparisons across years. We have shown in prior Index reports that even though raw scores remained relatively constant across years, the percent passing fluctuated downward as a function of setting a new standard for “passing”. The adoption of the Common Core creates an entirely new framework not comparable with prior years. That said, comparisons within a given year (like those we do for low-, mid-, and high- poverty schools) are still valid.
Fourth Grade English
The percent passing the English 4 test shows a pattern of decline beginning in 2010. These declines reflect the combination of changes in curriculum, content, and standards for being considered proficient.
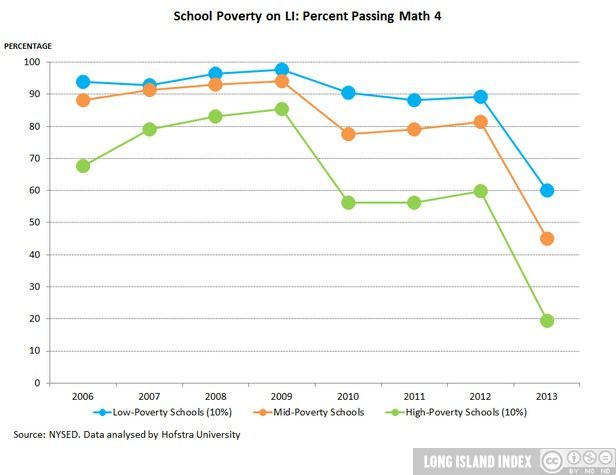
Next consider the English 4 results disaggregated by school poverty. The chart shows steady performance for all schools through 2009, with the poorest schools still substantially below their mid poverty and low poverty counterparts. Again, starting in 2010, there is a decline for all three categories that is likely the result of curricular changes. There is an indication that changing the cut line for passing did have a larger impact on performance of students in high-poverty schools.
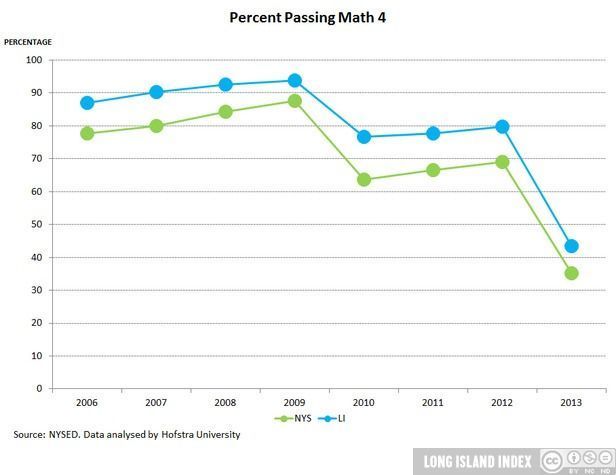
4th Grade Mathematics
The performance of students on 4th grade math tests shows a similar pattern to what we describe for English. Overall, students’ performance shows slight increases until 2010. The declines in percent passing seemingly reflect adoption of new thresholds for demonstrating proficiency beginning in 2010.
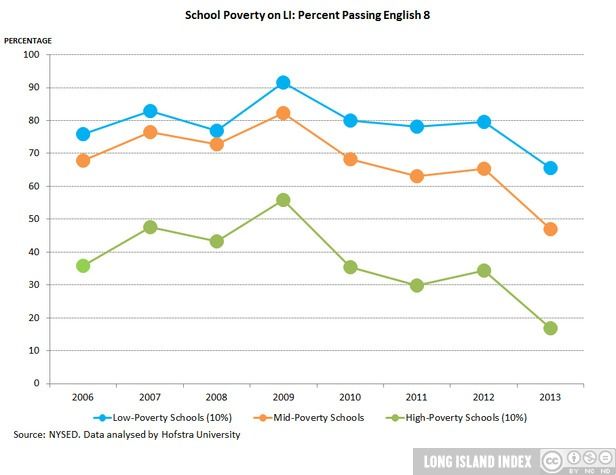
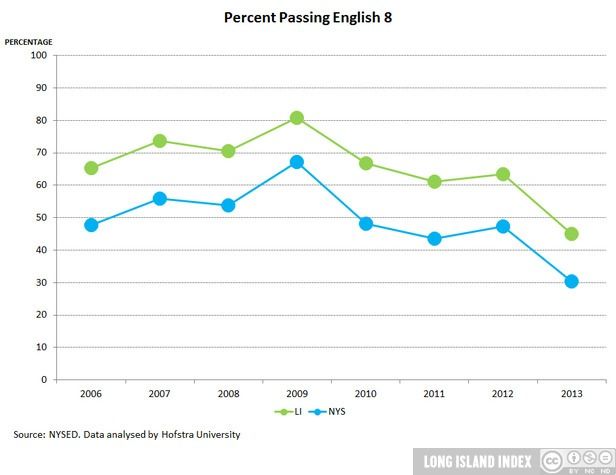
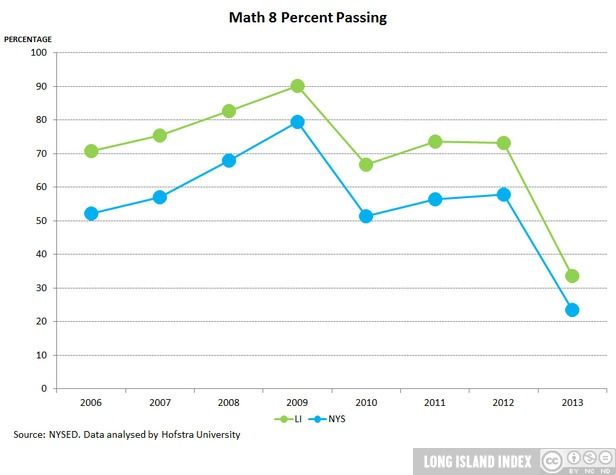
8th Grade English and Math Performance
The patterns for 8th grade English and Math are very similar to the 4th grade counterparts. Improving trends through 2009 were reversed beginning in 2010. Long Island students continue to outperform New York State students as a whole. While the 2012 numbers are better for both tests than they were in 2010, performance declined sharply in 2013 when only 45% of Long Island students passed the English 8 exam and 34% passed the 8th grade math exam.
The comparison across schools with different levels of poverty reveals differential changes. The gap between high-poverty schools and their more fortunate counterparts was actually decreasing between 2006 and 2009. However, beginning in 2010 the performance gap has widened. Most of that impact was observed in 2010. Interestingly, the gap between high- and mid- and low-poverty schools shrunk dramatically in between 2012 and 2013 on the 8th grade math test. However, this was not based on improved performance in the high-poverty schools. Rather, it was based on a steeper decline in pass rates in the mid and low-poverty schools.