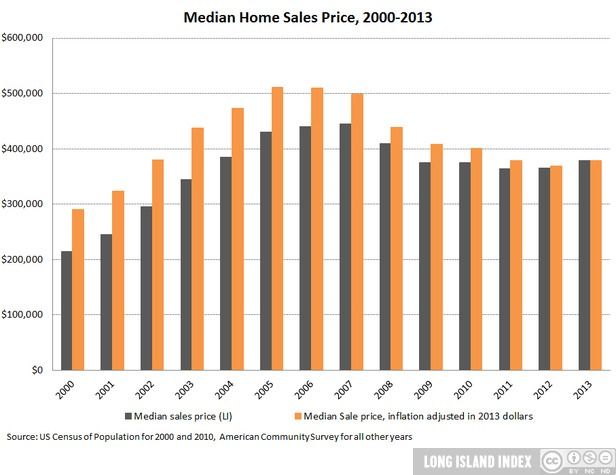
Housing prices have increased, with the average single-family home selling for $378,500, while the average household income held steady at $90,800.
Why is this important?
Homes are the major source of wealth for most people, and housing costs represent the largest part of household budgets. Home values and rents are also indicators of the health of the economy. Since 2006 the sudden drop in home values has prevented many home owners from selling their homes or forced them into foreclosures. Empty, foreclosed homes are not only tragic for the households but also negative impact the communities and the nearby homes. In late 2010 New York State made legislative changes in foreclosure process, which made foreclosures more difficult and dramatically drove down the number of foreclosures. Therefore, the housing market is very likely to be more complicated and unpredictable in the next a few years.
How are we doing?
Housing prices are showing a recovery after the plunge in prices from 2005, when the inflation-adjusted median price was at a high of $511,700, to a low in 2012, when the median price was $368,700.
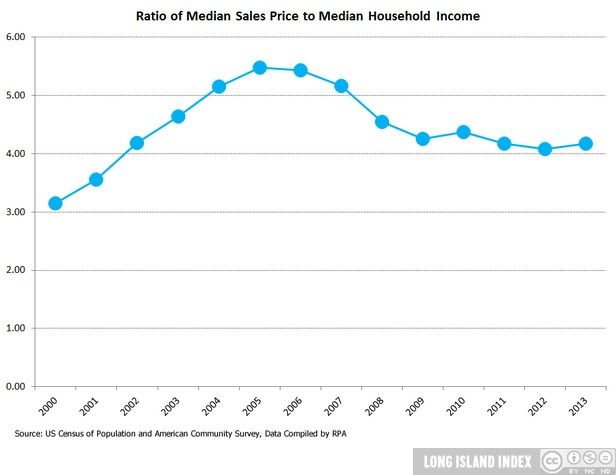
Median household income, adjusted for inflation, has held steady at just under $91,000 for the last three years after declining from a high of $96,500 in 2007. An average home sells for 4.2 times the average income, down from 5.5 in 2005 but still a high ratio by historical standards.
Median prices can hide the range of homes affordable to people at different income levels. The decline in housing values can be a major financial loss to someone trying to sell their home, and results in a decline of new housing construction that helps the overall economy and that is needed for new households. In the short term, however, this has led to an increase in the number of moderately priced homes. In 2006 there were only 1,500 homes that sold for less than $250,000. In 2013, 5,400 homes were sold for less than that amount.
Rental Market
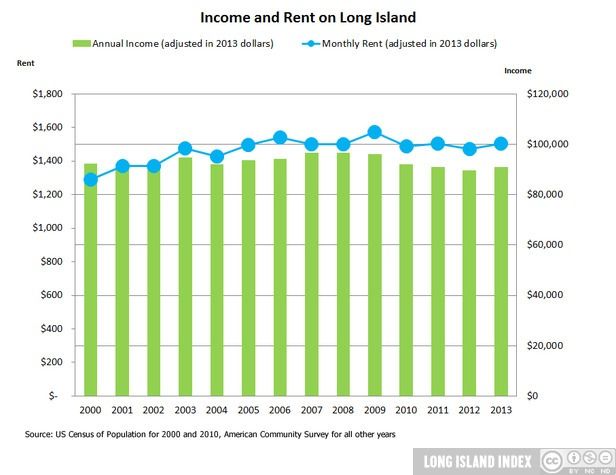 Unlike the slight decline in rents in 2012, rents have returned to levels seen in 2011 with renters paying an average of $1,503 per month. In 2013, the median rent was $1,503, slightly higher than the inflation-adjusted rent of $1,473 in 2012, and on par with the 2011 median of $1,504. Overall, inflation-adjusted rents are 4% lower than they were at their peak at $1,572 in 2009, but are still 2% higher than they were a decade ago in 2003. Over those 10 years, however, median incomes have declined by 4%, making it much more difficult for many individuals and families to afford a rental home.
Housing Cost Burden
The share of Long Island households paying a high share of their incomes for housing has stabilized, showing no change between 2012 and 2013.
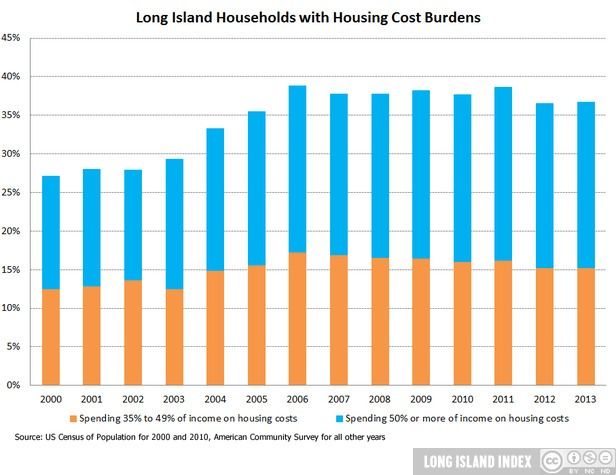
The share of households paying more than 35% of their income for housing remained the same in 2013 at 37%. Until 2012, the share has fluctuated only slightly around 38 or 39%. Those paying more than half their income for housing represent 21% of households, also the same as in 2012, and just slightly less than in 2011. Still, the housing cost burden for those paying 35% or more of their income for housing remains very high by historical standards, and was as low as 29% a decade ago in 2003.
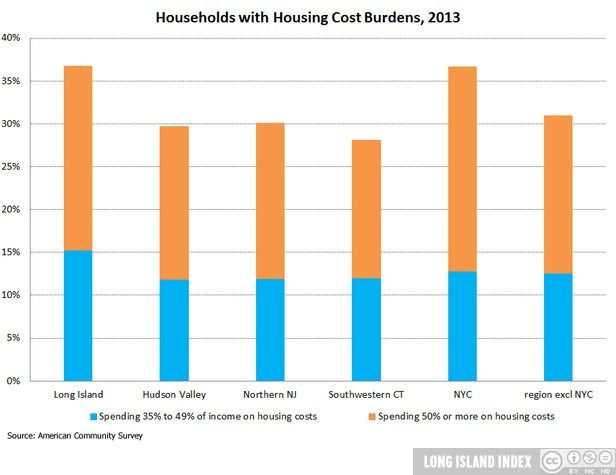
While the housing cost burden on Long Island has stabilized, other suburban parts of the New York region are starting to see a decline. In 2013, the 37% share of households paying more than 35% of their income for housing was above the 30% share found in the Hudson Valley, northern New Jersey, and southwestern Connecticut.
Rental Market
The share of Long Island housing units that are rentals rose to 21% in 2013 from 20% in 2012, and is the same as the share in 2010 and 2011. Long Island’s share of rental housing remains far below the share in other parts of the New York region.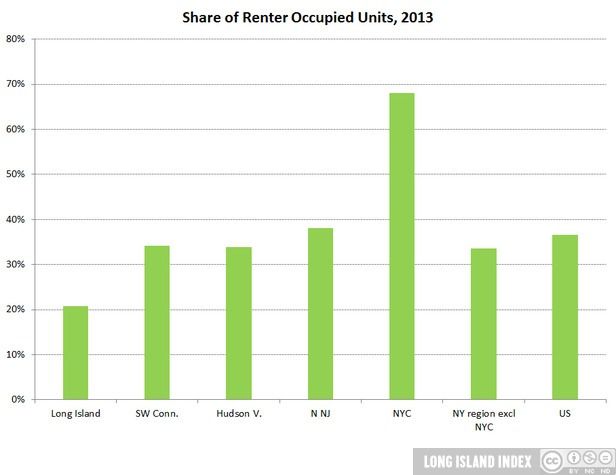
Long Island remains the place with by far the smallest share of rental housing, compared to the other suburbs in the region. The share has fluctuated around 20% since 2000. While only one out of five occupied housing units is a rental household on Long Island, the ratio in the region’s other suburbs is at least one out of three.
Housing Permits
Permits were issued for 2,200 new housing units in 2013, up by about 400 in 2012 and the first year since 2008 that more than 2,000 units of new housing units were built
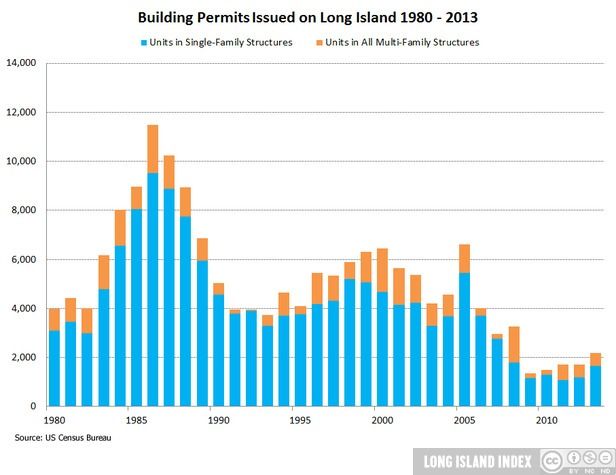
As recently as 2005, 6,600 units of housing received permits for construction. The residential construction market remained depressed nationally as well as on Long Island, and only began to turn up in 2012. However, the cyclical decline was layered on top of a long-term trend of modest housing construction. Some communities are still suffering from the devastation from super-storm Sandy in 2012, some of the increase in new housing units may be a reflection of the ongoing rebuilding.
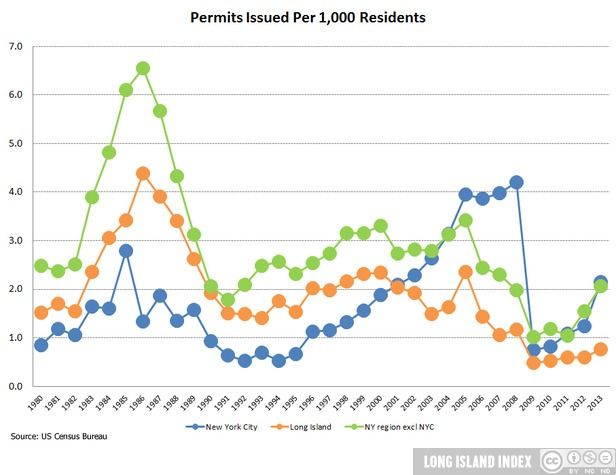
In the seven years since 2006, a mere 14,700 units have been permitted on the Island, the lowest across the region on an absolute basis. Long Island had less permits issued (0.8 permits issues per 1,000 residents) on per capita basis than any other part of the New York metropolitan region. The share of permits for multi-family units significantly declined in 2013. Over the last decade since 2003, Long Island’s 22% share for multi-family was considerably below the 39% share in southwestern Connecticut, 38% in the Hudson Valley, and 53% in northern New Jersey.