Race, ethnicity and education
Historically, racial and ethnic minorities in the United States, particularly Blacks and Latinos, have suffered most from disproportionate funding of education. These minority groups are overrepresented among the poor. In addition, the cumulative impact of economic and racial segregation means that minorities are also over-represented in schools impacted by poverty. This creates a cycle in which those who need quality education most to raise their future socioeconomic status tend to go to schools that have highly concentrated poverty.
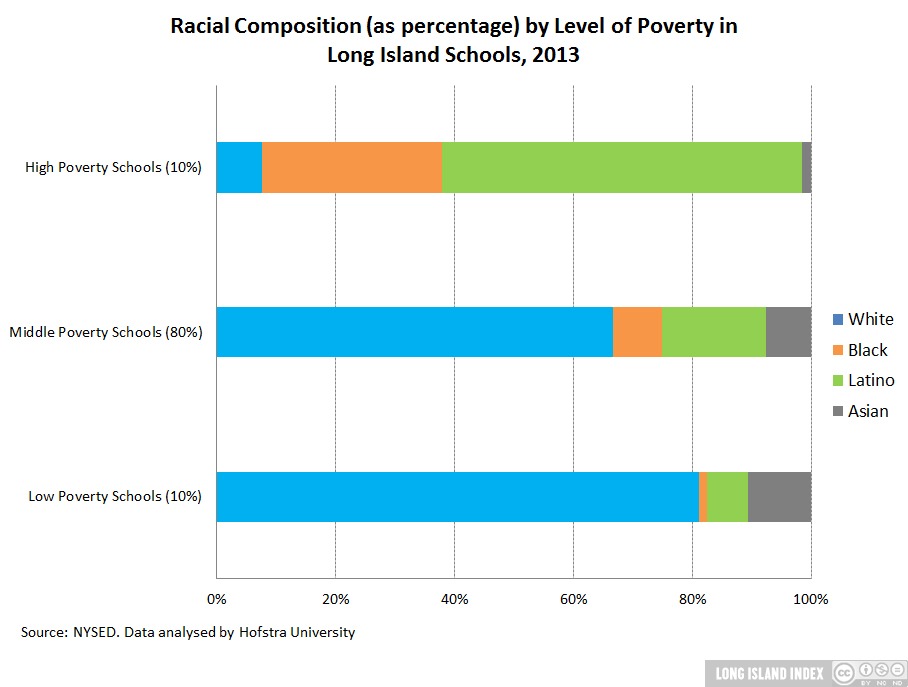
The overall composition of the student body on Long Island in 2013 was 61% White and 39% from ethnic and racial minority groups. However, Long Island schools are highly segregated. Both White and Asian students tend to go to schools that are more homogenously White. Significantly, ethnic disparities tend to be associated with economic inequalities. Black and Hispanic students are much more likely to attend a high poverty school (10% of schools with the highest proportion of students receiving free lunch) than either White or Asian students. In 2013, 90% of students in high-poverty schools are either Black or Hispanic (30% and 60%, respectively). In contrast, 8% of students in high-poverty schools were White and 1% Asian.
While dividing schools by level of free lunch necessarily means “high” poverty schools will have more students receiving free lunch than mid- and low poverty schools, the gap between the categories is not predetermined. The larger the gap from one category to the other, the greater the level of inequality across schools.
Looking at the “disaggregated” chart, two trends become apparent. First, the steady rise in overall poverty since 2006, and especially since 2009, does not occur in low poverty schools. All LI poverty and all its increases are located only in mid- and high poverty schools, and especially high poverty schools (from 2010 to 2011, poverty was flat in mid-poverty schools, while it rose in high poverty schools). Since the increase is concentrated only in mid- and high poverty schools, inequality is increasing. That is, in the chart, the gap between the low poverty line and the other lines has gotten wider. In 2011, low poverty schools averaged nearly 0% of students receiving free lunch, while high poverty schools had more than 63% of their students receiving free lunch.