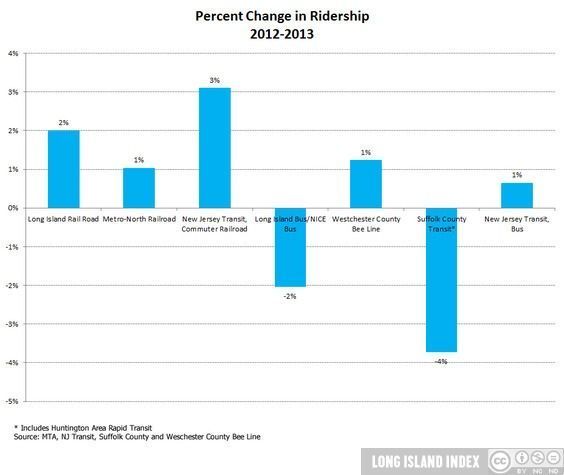
Percent Change in Ridership, 2012-2013
Percent Change in Ridership on the Long Island Rail Road and others, 2012-2013
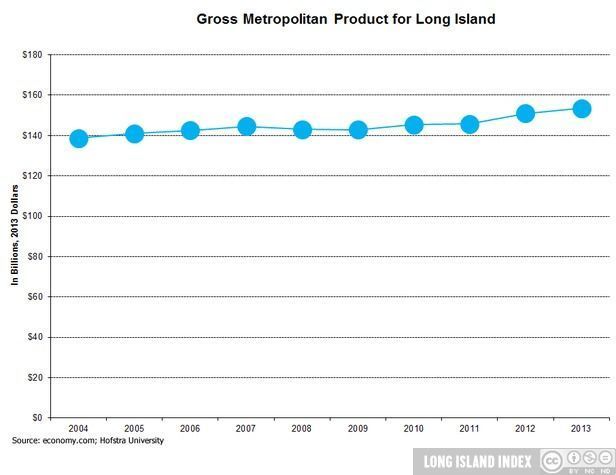
Gross Metropolitan Product, 2004-2013
Long Island’s Gross Metropolitan Product, 2004-2013
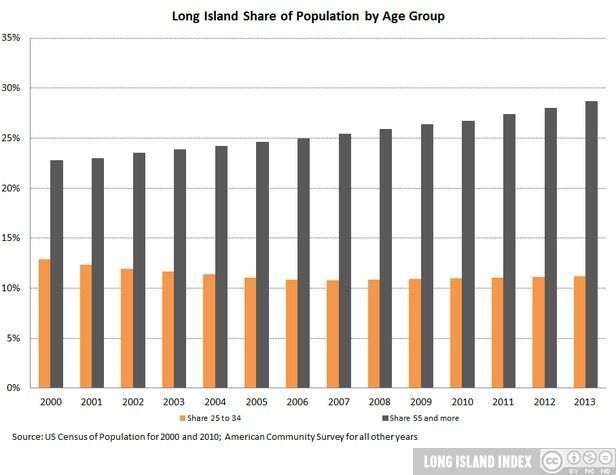
Share of Population by Age Group, 2000 – 2013
Share of population by age group on Long Island, 2000-2013
Median Home Sales Price, 2000-2013
Median home sales price on Long Island, 2000-2013
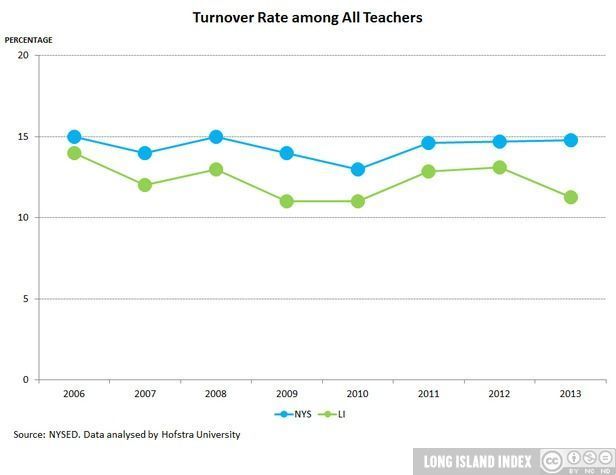
Teacher Turnover Rate LI & NYS, 2006-2013
Turnover rate among all teachers on Long Island & NYS, 2006-2013
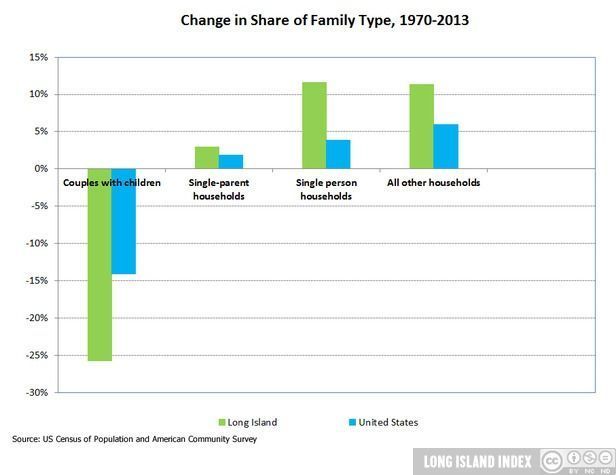
Change in Share of Family Type, 1970-2013
Change in share of family type on Long Island, 1970-2013
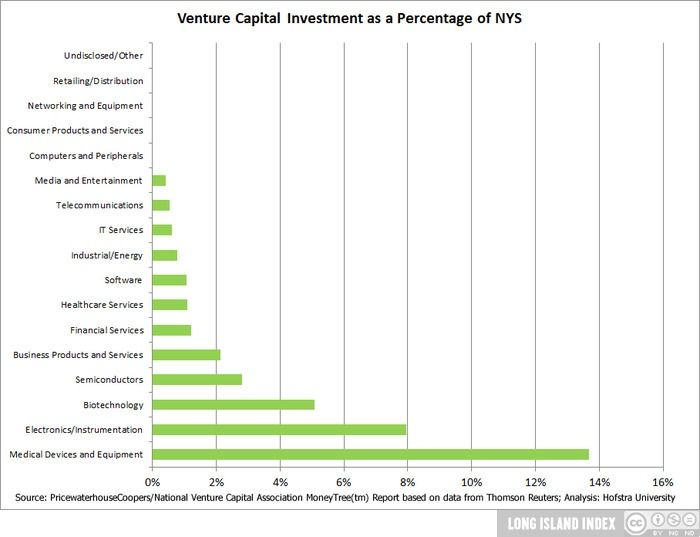
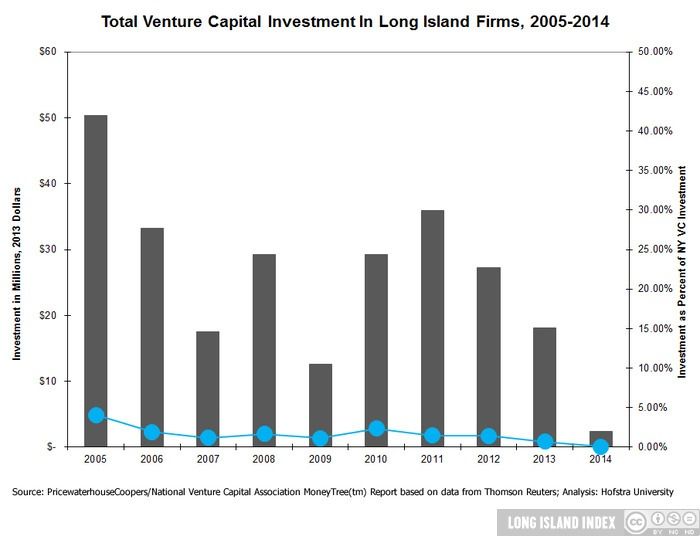
Venture Capital Investment as a Percent of NYS
Venture Capital investment on Long Island as a percent of NYS
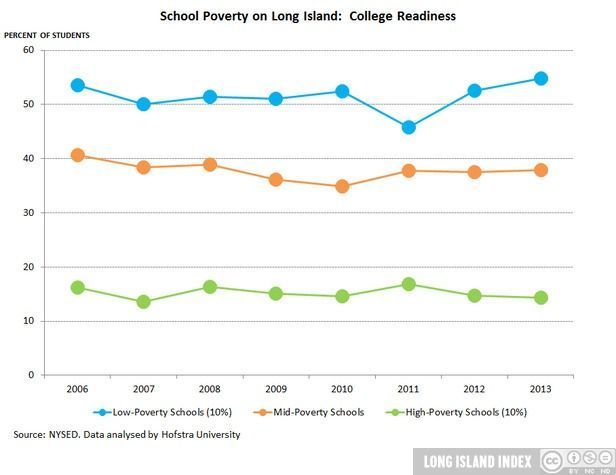
College Readiness on LI, 2006-2013
School Poverty on Long Island: College readiness, 2006 – 2013
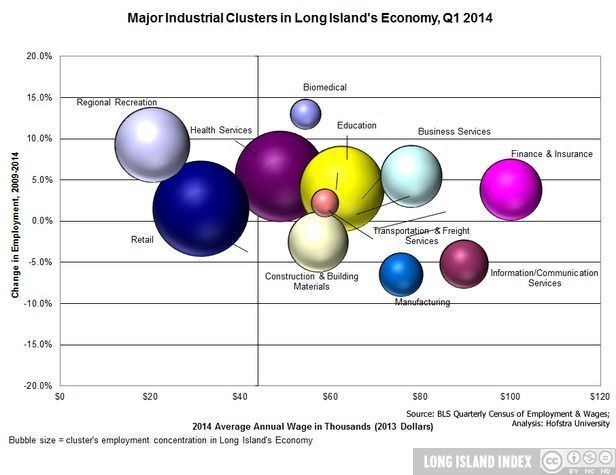
Major Industrial Clusters Change in Employment and Wages, 2009-2014
Major industrial clusters in Long Island’s economy, 2009 – 1 Quarter 2014, change in employment and wages
Housing Permits Issued, 1990-2013
Housing permits issued per 1,000 residents, 1990-2013, LI, NYC & NY Region
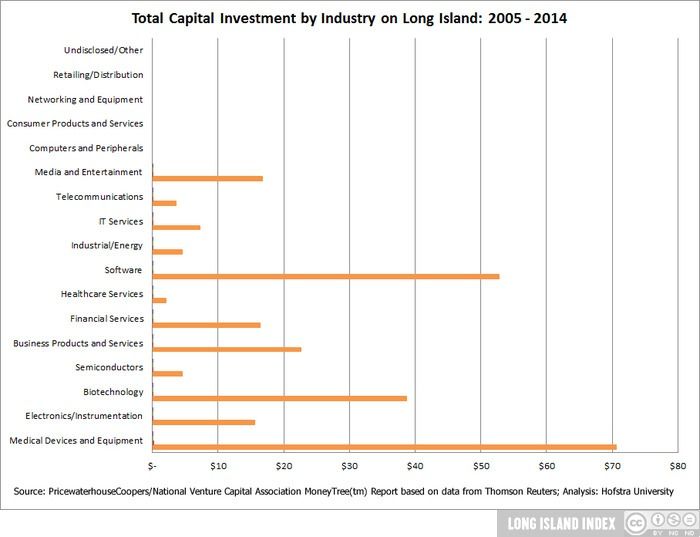
Total Capital Investment by Industry
Total Capital Investment by industry on Long Island, 2005-2014
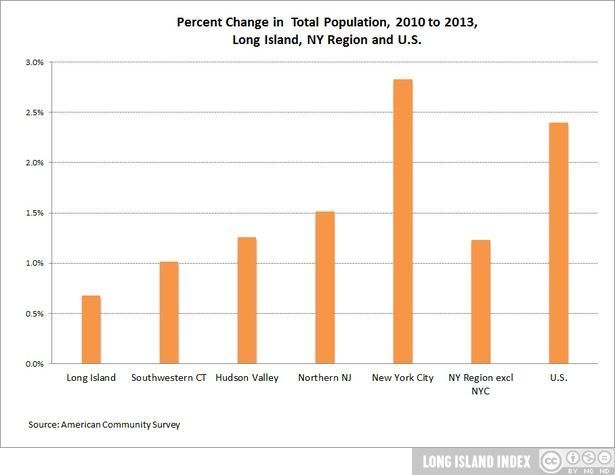
Change in Total Population for LI and Others, 2010-2013
Change in total population on Long Island and in other suburban communities, 2010-2013
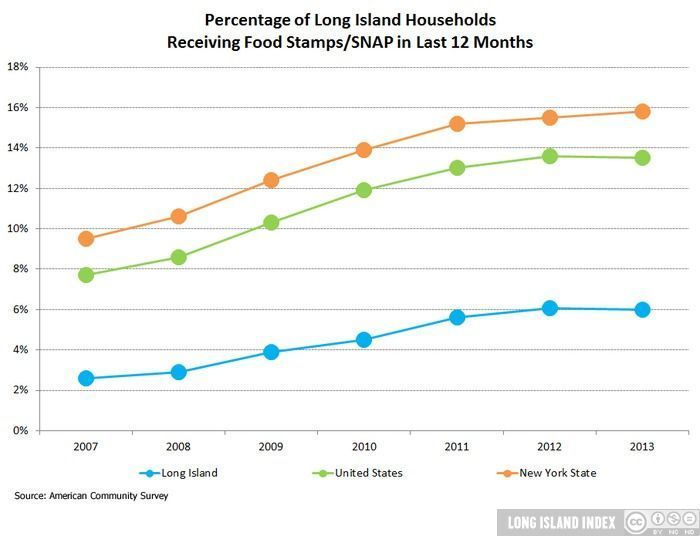
Percent of Families Receiving Food Stamps, 2007-2013
Percent of Long Island families receiving food stamps, 2007-2013
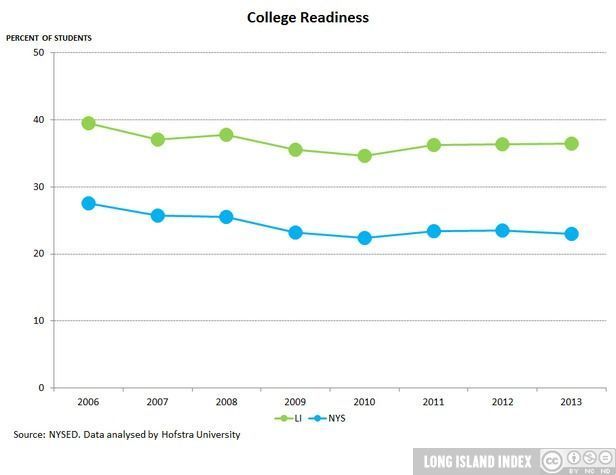
College Readiness LI & NYS, 2006-2013
College readiness on Long Island & NYS, 2006-2013
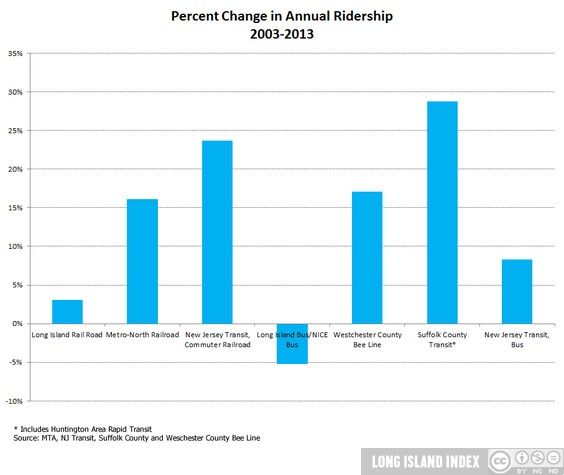
Percent Change in Ridership, 2003-2013
Percent Change in Ridership on the Long Island Rail Road and others, 2003-2013
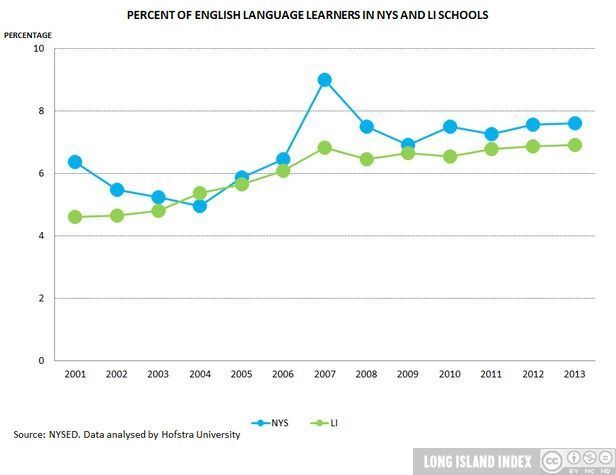
English Language Learners on LI, 2001-2013
School Poverty on Long Island: Percent of English language learners, 2001-2013
Racial and Ethnic Composition, 1990-2013
Racial and ethnic composition on Long Island, 1990-2013
LI Households with Housing Cost Burdens Compared to Others, 2013
Long Island households with housing cost burdens in comparison with other suburban communities, 2013
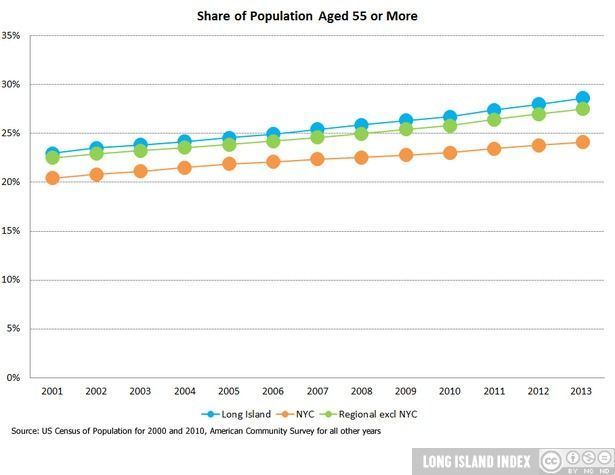
Share of population aged 55+, 2001-2013
Share of population aged 55 or more: Long Island, New York City and rest of New York region, 2001-2013
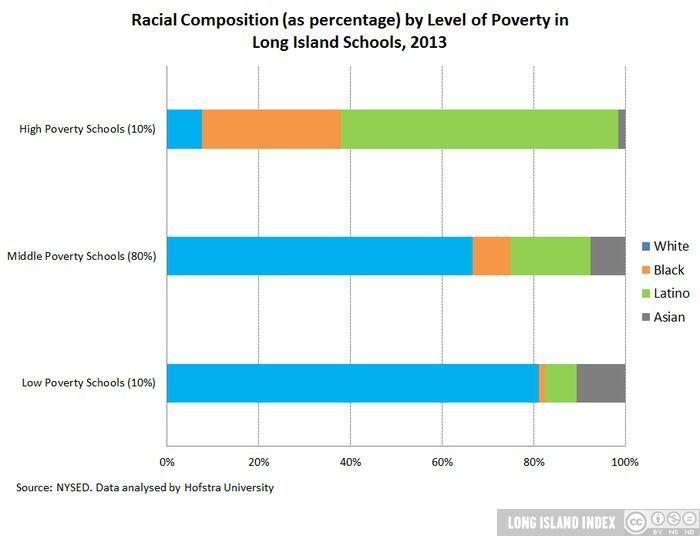
Racial and Ethnic Composition, 2013
Racial Composition by Level of Poverty in LI Schools, 2013
Total Venture Capital Investment
Total Venture Capital investment in Long Island companies compared to US, 2005-2014
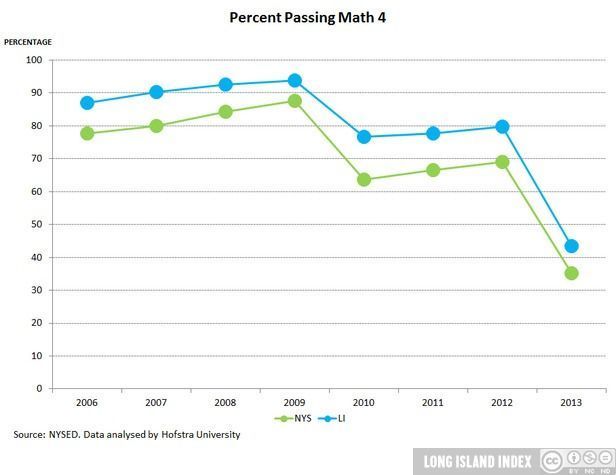
Passing Math 4 on LI, 2006-2013
School Povert on Long Island: Percent of students passing Math 4, 2006-2013
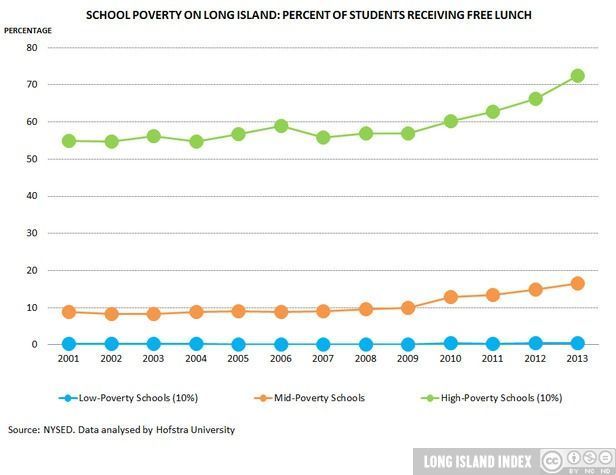
Students Receiving Free Lunch on LI, 2001-2013
School Poverty on Long Island: Percent of Students Receiving Free Lunch, 2001-2013
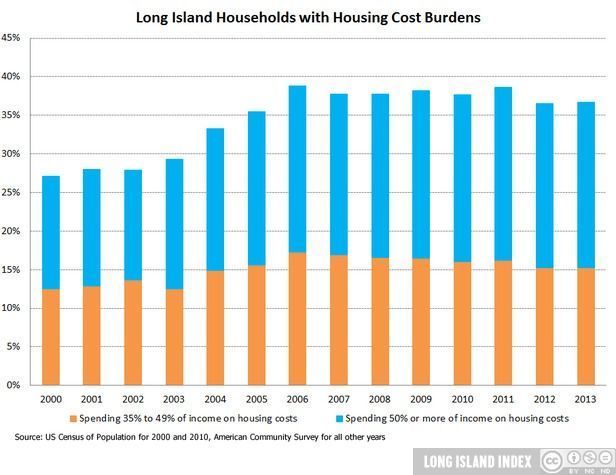
Households with Housing Cost Burdens
Long Island Households with Housing Cost Burdens, 2000-2013