How important is it to you to live within walking distance of a train station or bus stop?
Responses may not add to 100% due to rounding. Results for LI residents only.
Do you think the quality of life has gotten better, worse or stayed the same?
This poll focuses on Long Island residents’ ongoing concerns about local life with a special focus on the local housing supply and its affordability. It was conducted by Princeton Survey Research Associates during the fall of 2015.
How strong of a sense of community do you feel?
This poll focuses on Long Island residents’ ongoing concerns about local life with a special focus on the local housing supply and its affordability. It was conducted by Princeton Survey Research Associates during the fall of 2015.
How strongly do you identify with your county?
This poll focuses on Long Island residents’ ongoing concerns about local life with a special focus on the local housing supply and its affordability. It was conducted by Princeton Survey Research Associates during the fall of 2015.
Housing Permits Issued, 1990-2013
Housing permits issued per 1,000 residents, 1990-2013, LI, NYC & NY Region
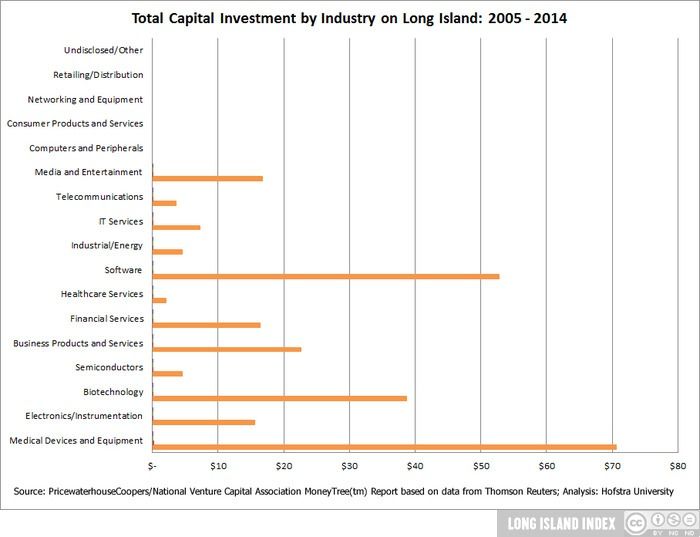
Total Capital Investment by Industry
Total Capital Investment by industry on Long Island, 2005-2014
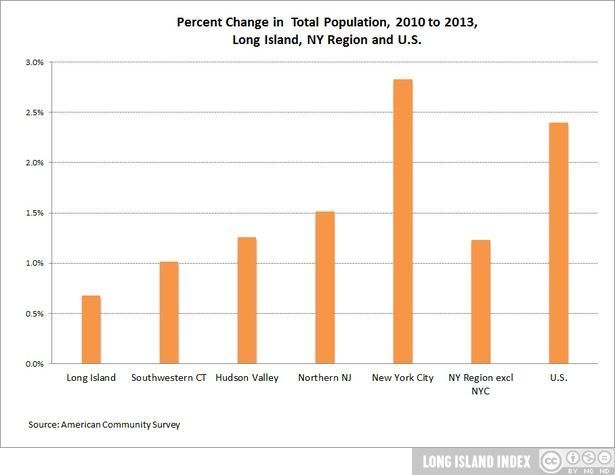
Change in Total Population for LI and Others, 2010-2013
Change in total population on Long Island and in other suburban communities, 2010-2013
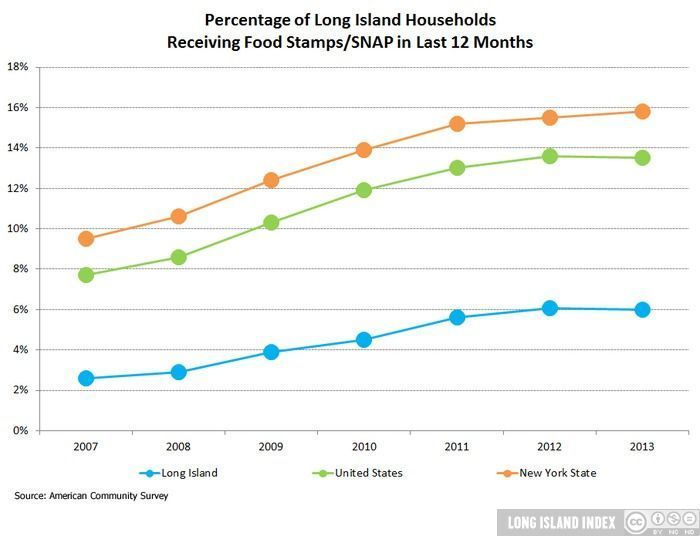
Percent of Families Receiving Food Stamps, 2007-2013
Percent of Long Island families receiving food stamps, 2007-2013
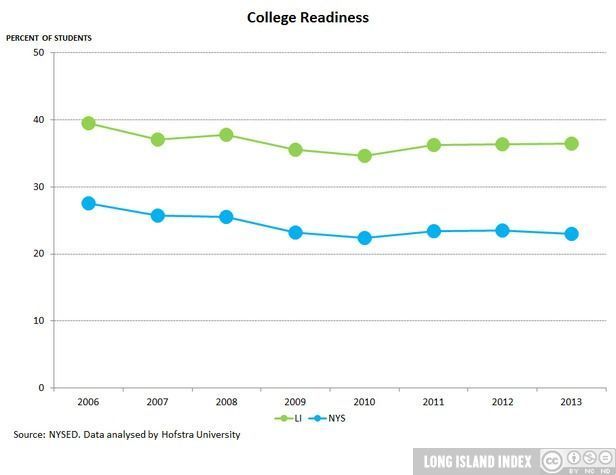
College Readiness LI & NYS, 2006-2013
College readiness on Long Island & NYS, 2006-2013
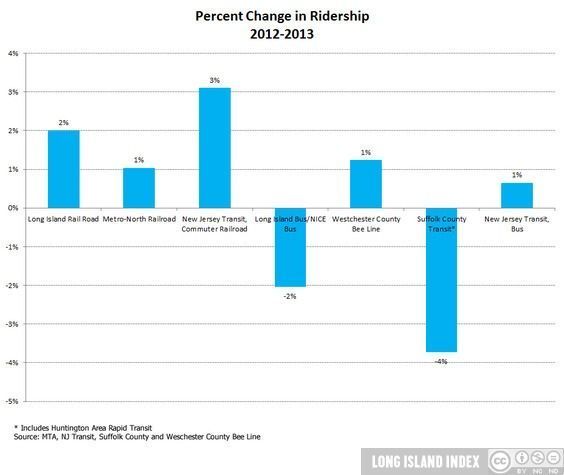
Percent Change in Ridership, 2003-2013
Percent Change in Ridership on the Long Island Rail Road and others, 2003-2013
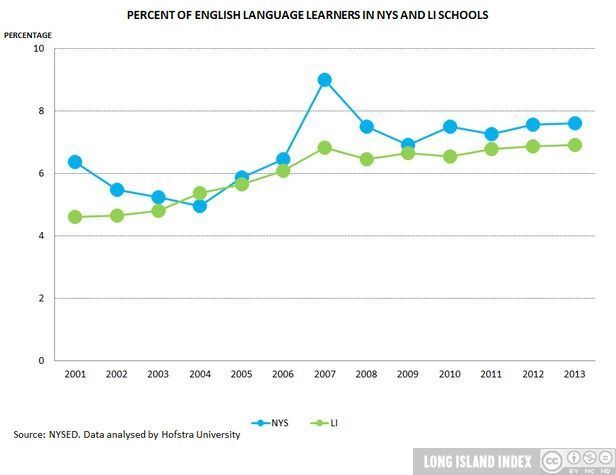
English Language Learners on LI, 2001-2013
School Poverty on Long Island: Percent of English language learners, 2001-2013
Racial and Ethnic Composition, 1990-2013
Racial and ethnic composition on Long Island, 1990-2013
LI Households with Housing Cost Burdens Compared to Others, 2013
Long Island households with housing cost burdens in comparison with other suburban communities, 2013
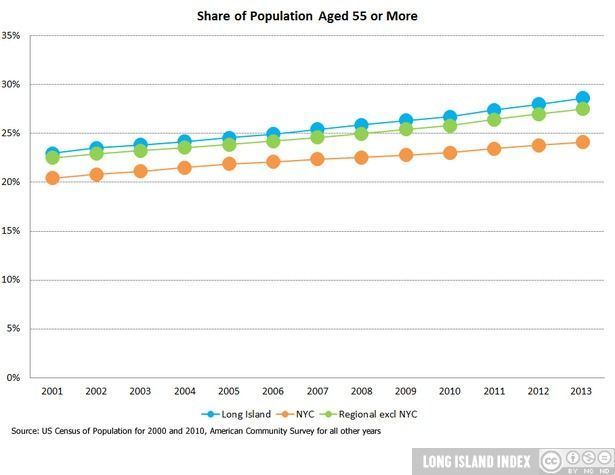
Share of population aged 55+, 2001-2013
Share of population aged 55 or more: Long Island, New York City and rest of New York region, 2001-2013
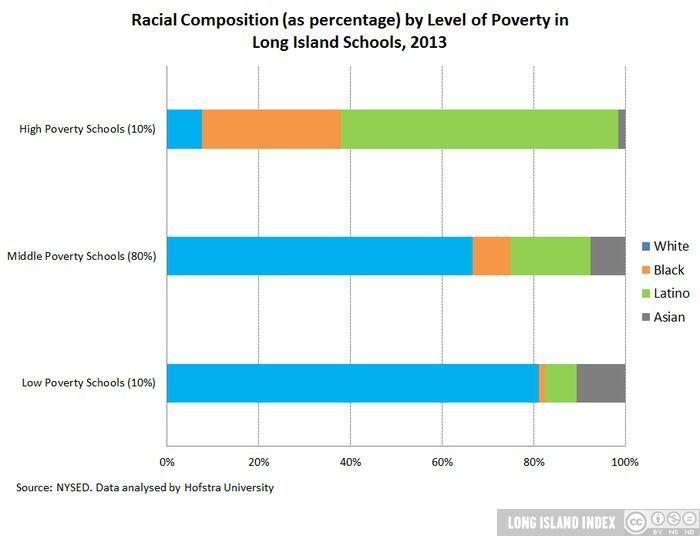
Racial and Ethnic Composition, 2013
Racial Composition by Level of Poverty in LI Schools, 2013
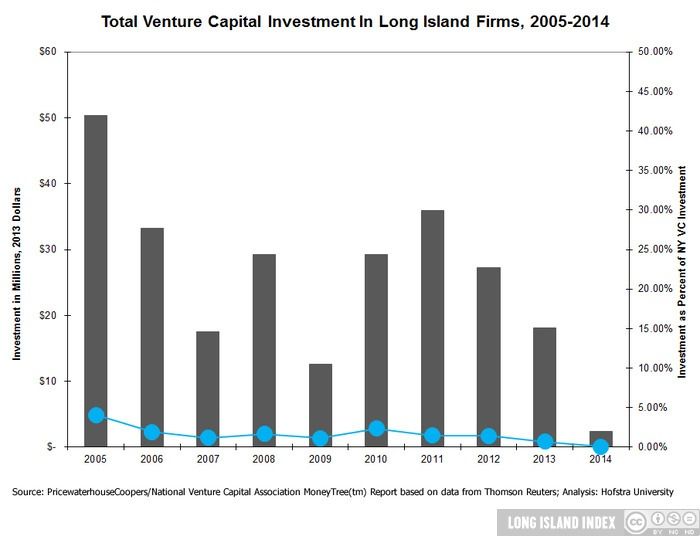
Total Venture Capital Investment
Total Venture Capital investment in Long Island companies compared to US, 2005-2014
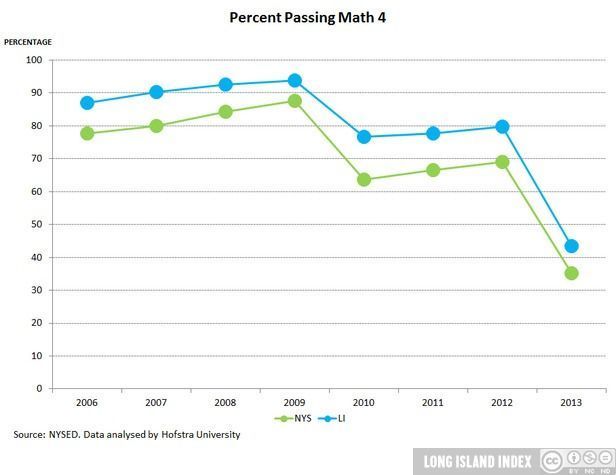
Passing Math 4 on LI, 2006-2013
School Povert on Long Island: Percent of students passing Math 4, 2006-2013
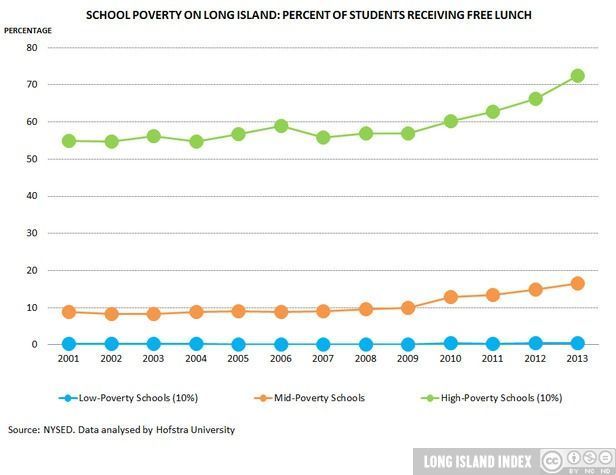
Students Receiving Free Lunch on LI, 2001-2013
School Poverty on Long Island: Percent of Students Receiving Free Lunch, 2001-2013
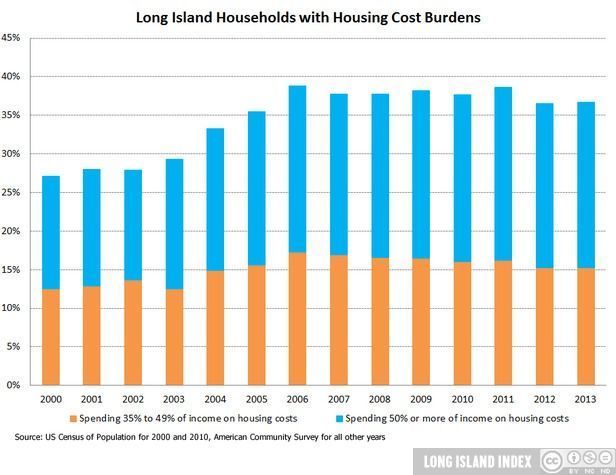
Households with Housing Cost Burdens
Long Island Households with Housing Cost Burdens, 2000-2013
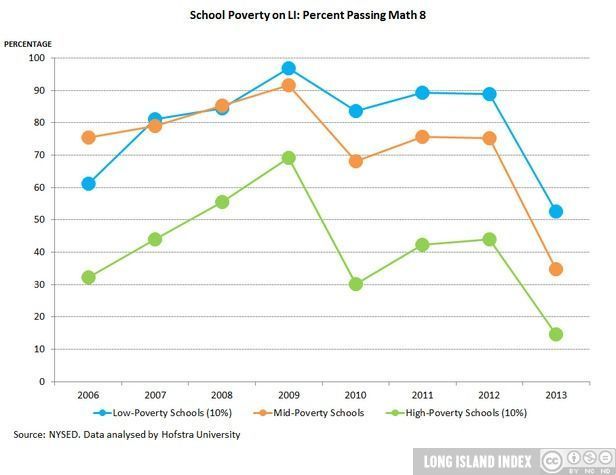
Passing Math 8 on LI, 2006-2013
School Poverty on Long Island: Percent of students passing Math 8, 2006-2013
Industry Clusters
Employment declines continue in the aftermath of the recession in some sectors; others show signs of growth. The largest employment losses occurred in higher-paying sectors.
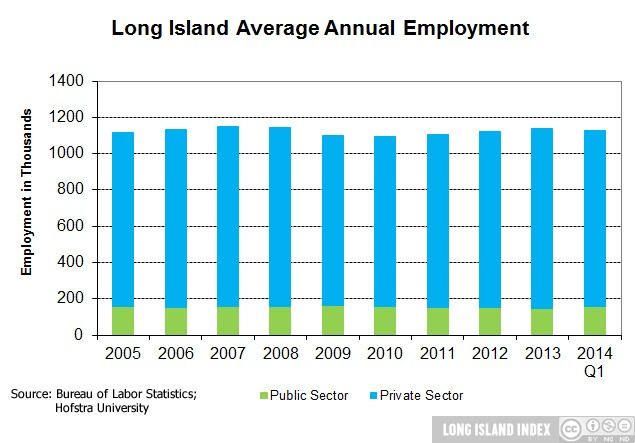
Employment Trends
Long Island’s private sector employment remains below pre-recession levels.
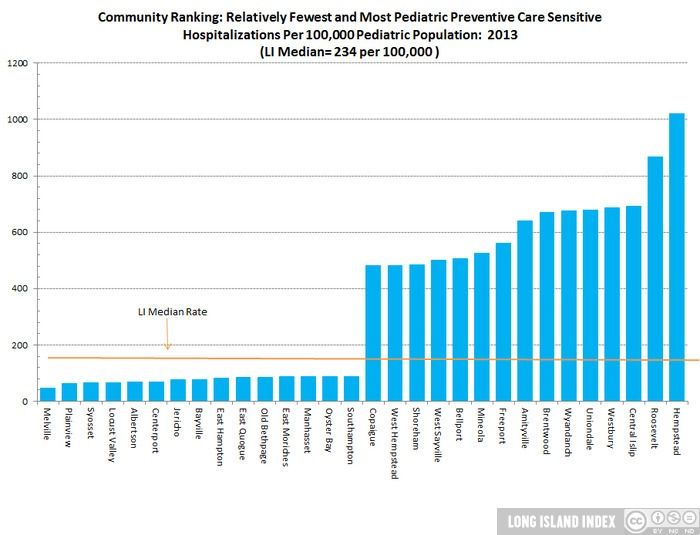
Pediatric Care Preventive Care Sensitive Hospitalizations, 2013
Comparative ranking of communities on Long Island with pediatric care preventive care sensitive hospitalizations, 2013
The Economic and Fiscal Impacts of the Long Island Rail Road Main Line Third Track (Full Report)
A report conducted by HR&A Advisors and Parsons Brinkerhoff highlights the enormous impact that an additional 9.8 miles of track on the LIRR Main Line could have on Long Island’s economy.