Still Separate & Not Getting More Equal
The persistence of economic and racial inequalities in education on Long Island.
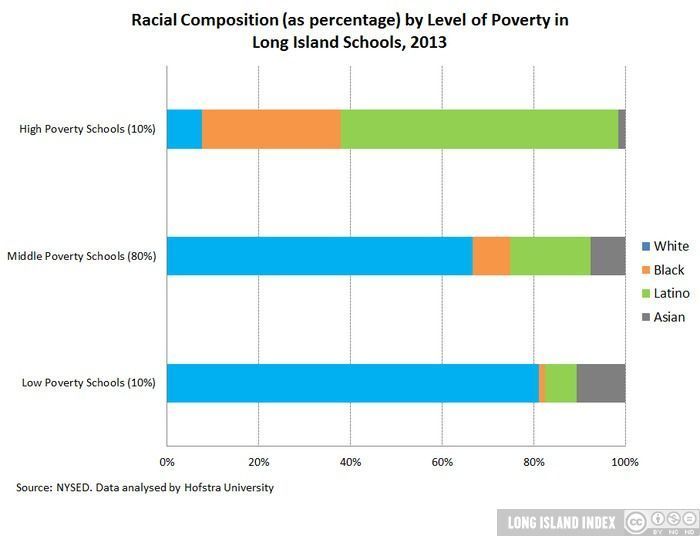
Racial Composition by Poverty Level, 2013
Racial composition by level of poverty in Long Island schools, 2013
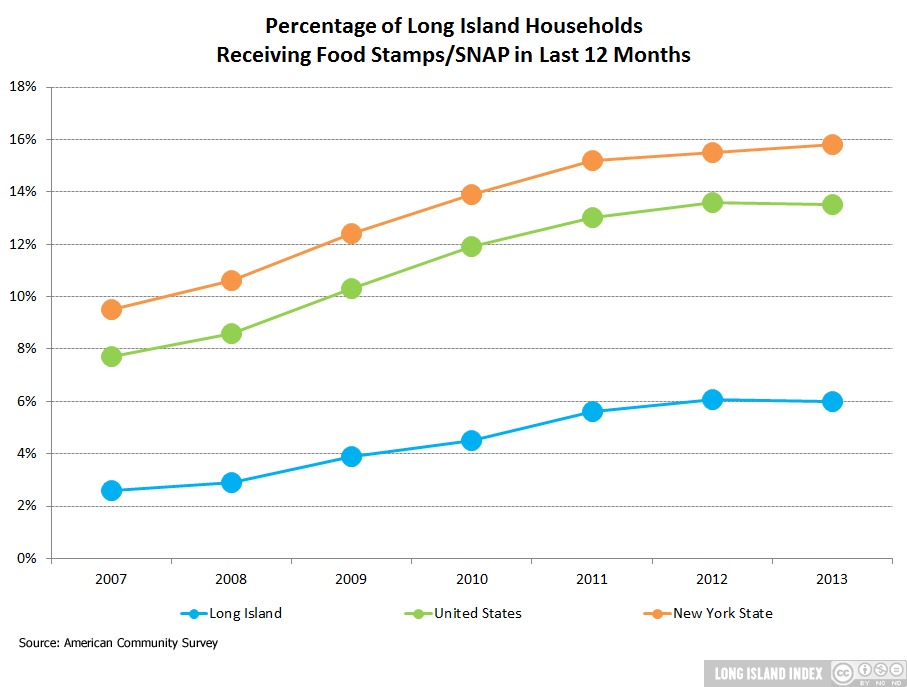
Percent of Individuals Below Federal Poverty Line, 2007-2013
Percent of Long Island Individuals below the Federal poverty line, 2007-2013
Ratio of Median Sales Price to Median Household Income, 2000-2013
Ratio of median sales price to median household income on Long Island, 2000-2013
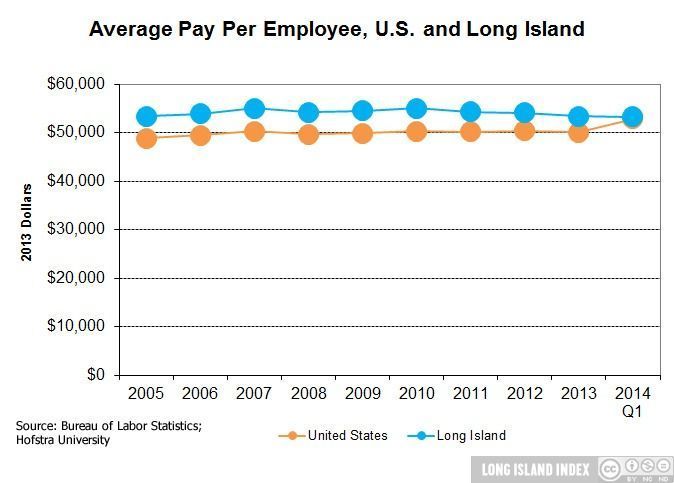
Average Pay Per Employee, 2005-2014
Average pay per employee on Long Island and in the US, 2005 – 1Q 2014
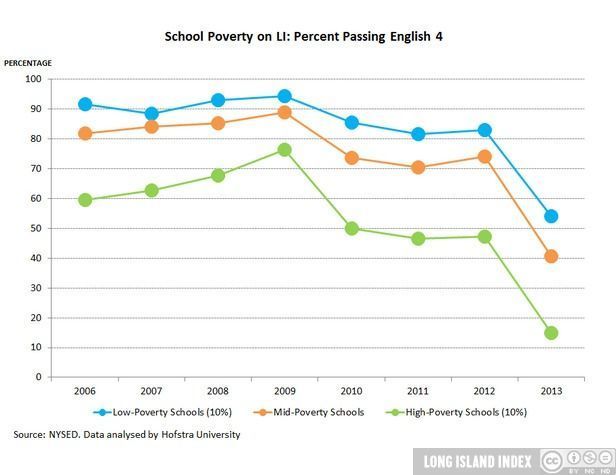
Percent Passing English 4 on LI, 2006 – 2013
School Poverty on Long Island: Percent of students passing English 4, 2006-2013
Venture Capital Financing
Long Island firms receive relatively little venture capital. Investment has declined since 2011.
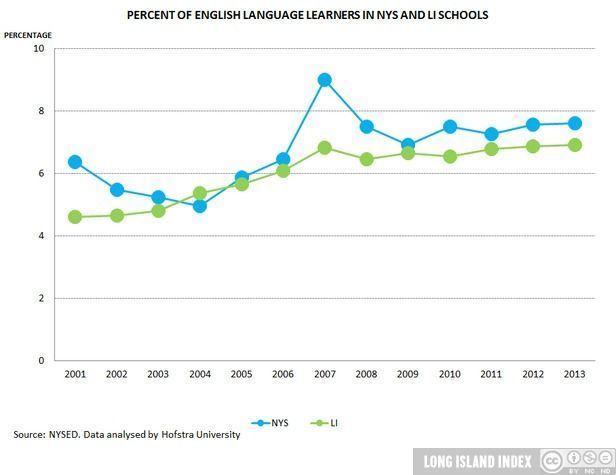
English Language Learners LI & NYS, 2001-2013
Percent of English Language Learners on Long Island & NYS, 2001-2013
Passing English 4 LI & NYS, 2006 – 2013
Percent of students passing English 4 on Long Island & NYS, 2006-2013
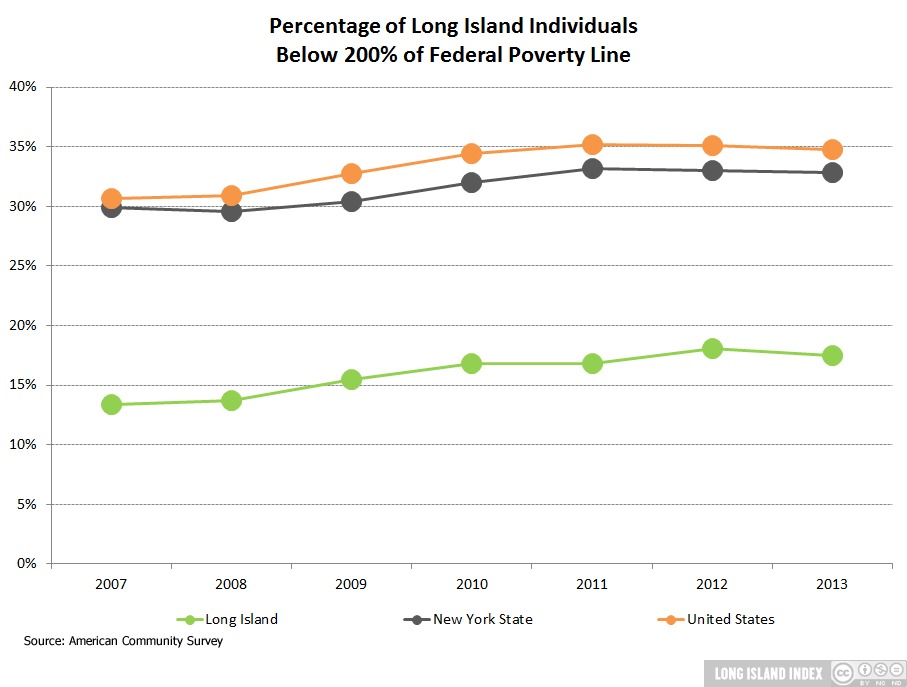
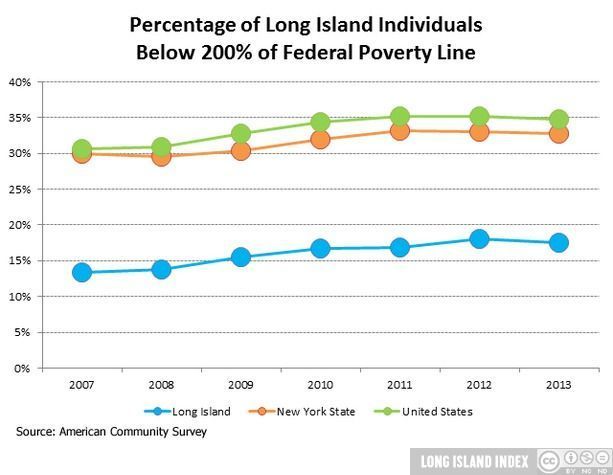
Percent of Individuals Below 200% of the Federal Poverty Line, 2007-2013
Percent of Long Island Individuals below 200% of the Federal poverty line, 2007-2013
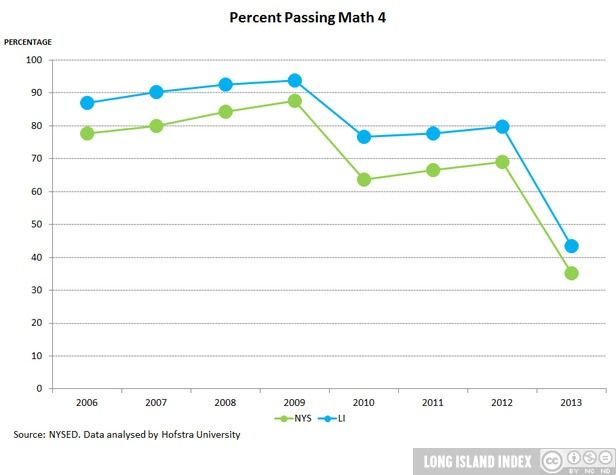
Passing Math 4 LI & NYS, 2006-2013
Percent of students passing Math 4 on Long Island & NYS, 2006-2013
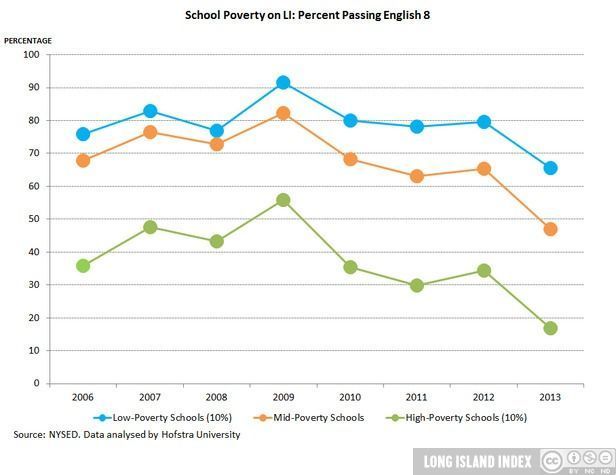
Passing English 8 on LI, 2006-2013
School Poverty on Long Island: Percent of students passing English 8, 2006-2013
Federal Small Business Innovation Research Technology Transfer Awards to Long Island
Small technology companies on Long Island remain competitive in attracting federal funding under the SBIR/STTR programs, which directly supports the private sector in the development and commercialization of innovative and early-stage technologies with significant potential for financial, economic and societal impact.
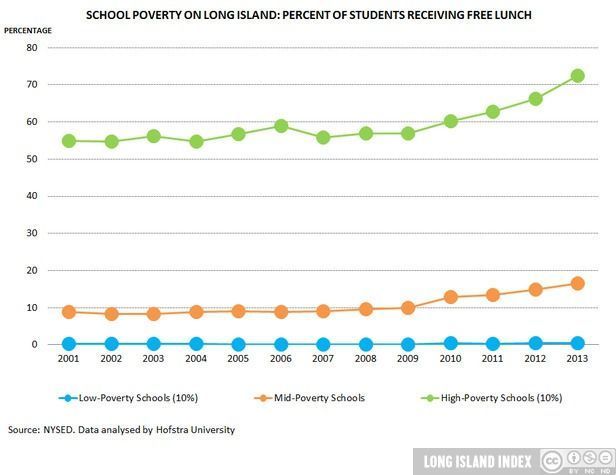
Students Receiving Free Lunch LI & NYS, 2001-2013
Percent of students receiving free lunch on Long Island and in NYS, 2001-2013
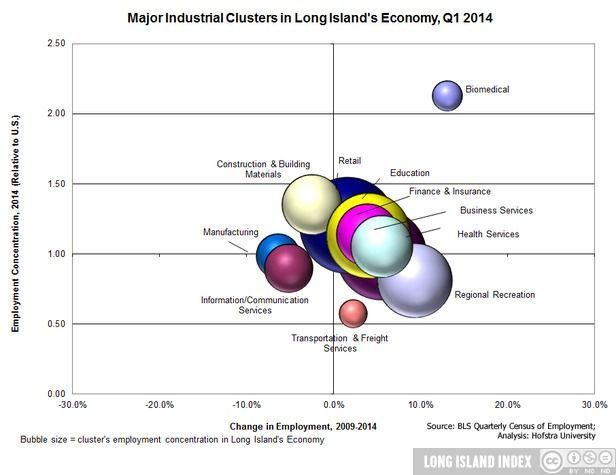
Major Industrial Clusters, Change in Employment Concentation, 2009-2014
Major industrial clusters in Long Island’s economy, 2009 – 1 Quarter 2014, change in employment concentration
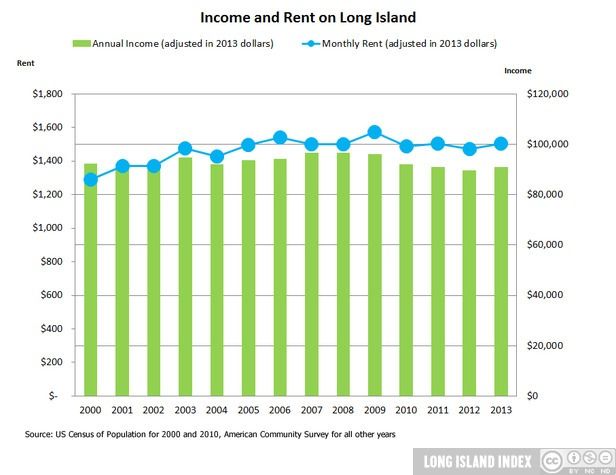
Household Income Distribution, 2005-2013
Household income distribution of Long Island residents, 2005-2013
Transit Ridership
Long Island Railroad added 1.6 million passengers in 2013, while bus ridership declined in BOTH Nassau and Suffolk.
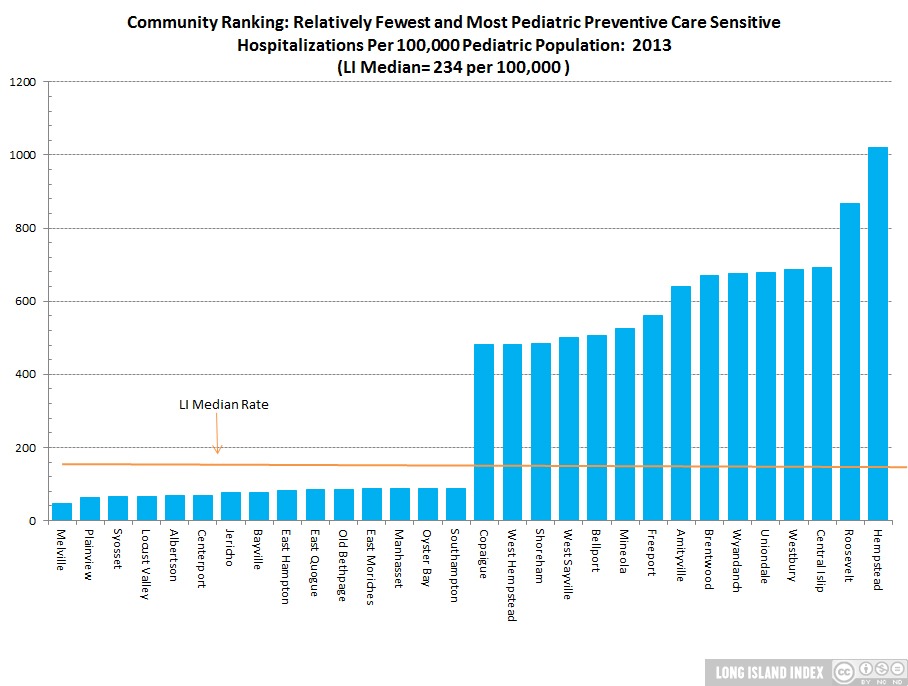
Childhood Healthcare
Poorer communities have significantly higher rates of preventable hospitalizations for a series of illnesses.
Brownfield Redevelopment
Known sites of environmental contamination are located in 136 Long Island communities.
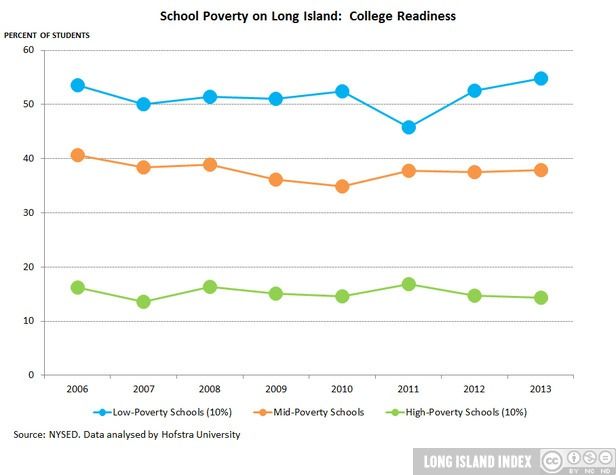
College Readiness
After a slight decline between 2006 and 2007, College Readiness has been essentially flat. Through 2013, there is a sizable gap in the performance between high and low poverty schools.
Teacher Education and Turnover
Long Island teachers tend to surpass New York State with greater educational preparedness. Turnover rates on Long Island were higher than NYS during the post-recession years, but returned to the State level in 2013.