Academic Performance: 4th Grade & 8th Grade
Overall Long Island schools’ 4th Grade English Language Arts performance results exceed New York State. The gap between low-poverty and high-poverty schools, narrowed until 2009, but has since increased. 8th Grade Math results continue to exceed New York State. Performance for high-poverty schools improved until 2009. Dramatic declines were seen in 2013.
English Language Learners
Students with Limited English Proficiency are disproportionately taught in high-poverty districts.
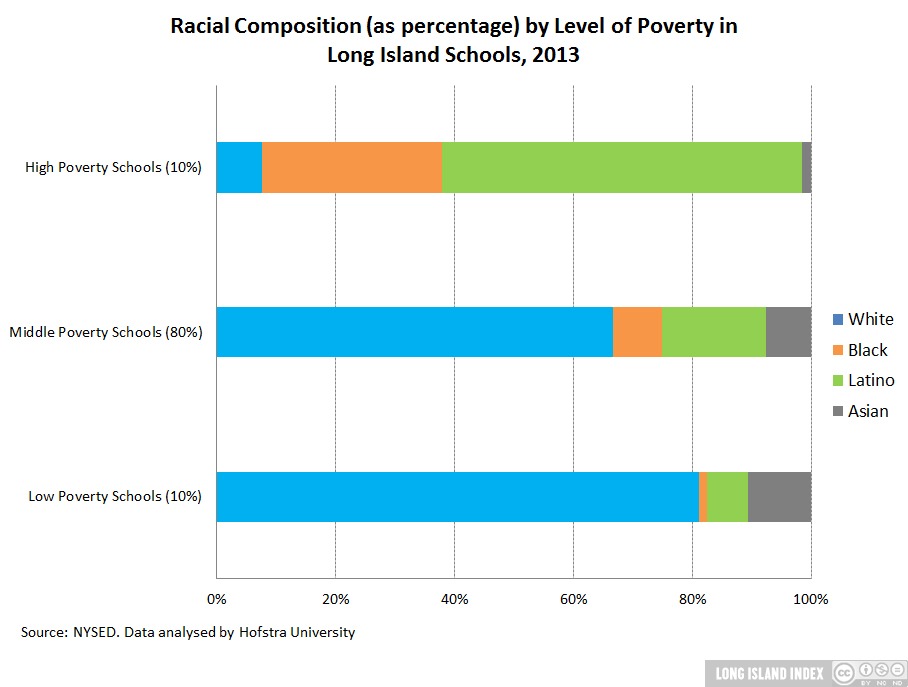
Race and Ethnicity
The racial and ethnic composition of Long Island schools is also noteworthy as Long Island remains one of the most residentially segregated areas of the United States.
Poverty Index
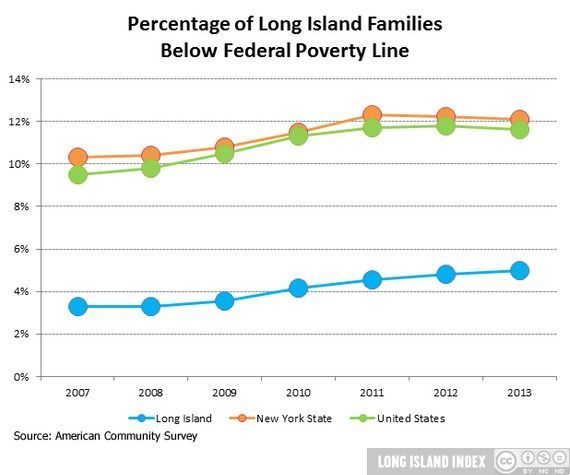
While overall poverty levels on Long Island are lower than NYS as a whole, poverty in Long Schools is increasing.
Housing Affordability
Housing prices have increased, with the average single-family home selling for $378,500, while the average household income held steady at $90,800.
Long Island’s Changing Population
Why is this important? The level of population growth is a fundamental benchmark of how attractive Long Island is as a place to live. New residents require more housing and services, but can also add to the vibrancy of growing communities, increase sales for local businesses and provide additional tax revenues. Growth in the working
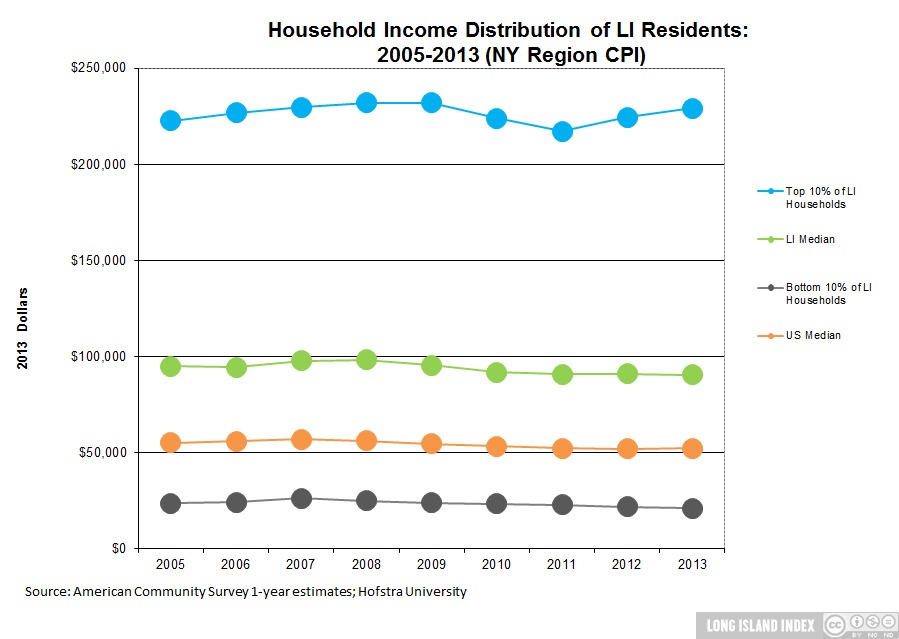
Household Income Distribution
Median household income continue to decline at the middle and bottom while rising at the top.
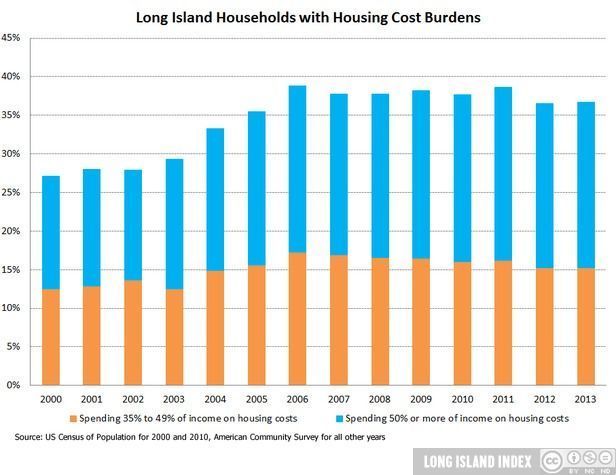
Households with Housing Cost Burdens, 2000-2013
Long Island Households with Housing Cost Burdens, 2000-2013
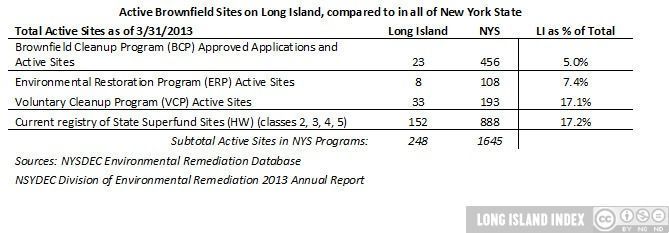
Active Brownfield Sites LI & NYS, 2013
Active Brownfield sites on Lon Island compared to NYS, 2013
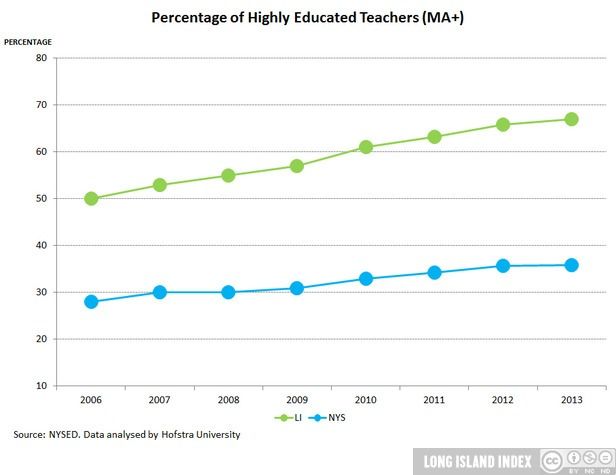
Highly Educated Teachers, 2006-2013
Percent of highly educated teachers on Long Island, 2006-2013
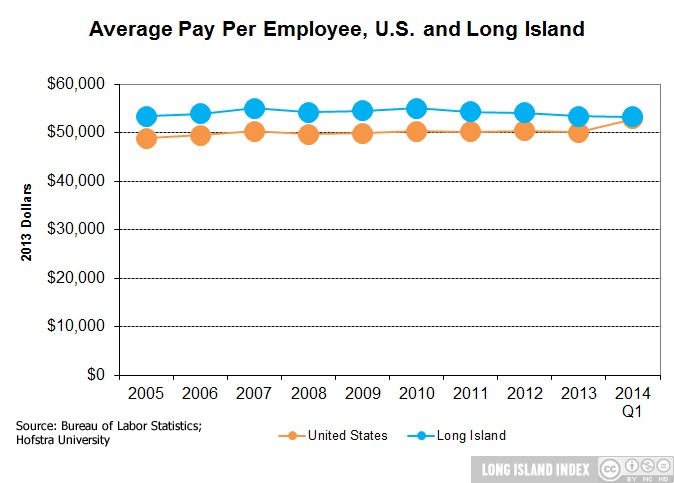
Growth in Wages over the Past 10 Years
Long Island wages continue a slight downward trend, while converging with U.S. wages which have risen slightly since the recession. U.S. average pay is on a par with Long Island in first the quarter of 2014.
Teacher Turnover Rate on LI, 2006-2013
School Poverty on Long Island: turnover rate among teachers, 2006-2013
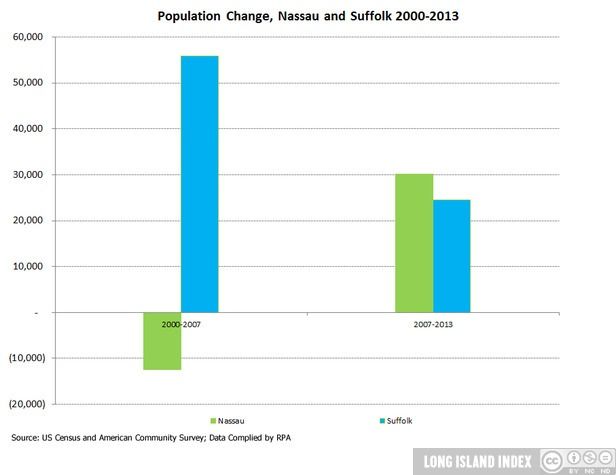
Change in Total Population Nassau/Suffolk
Change in total population in Nassau and Suffolk Counties, 2000-2013
Percent of Families Below the Federal Poverty Line, 2007-2013
Percent of Long Island families below the Federal poverty line, 2007-2013
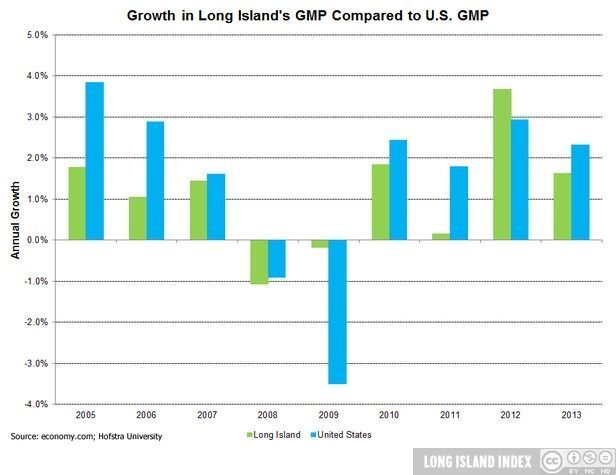
Growth in Long Island’s GMP Compared to the US
Growth in Long Island’s GMP compared to the US, 2005-2013
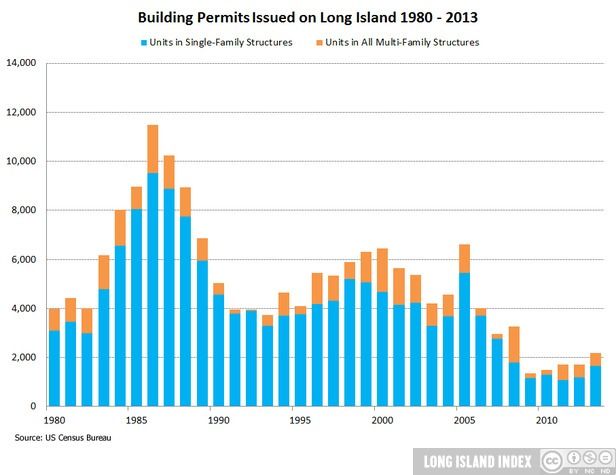
Building Permits Issued, 1980-2013
Building permits issued on Long Island, 1980-2013
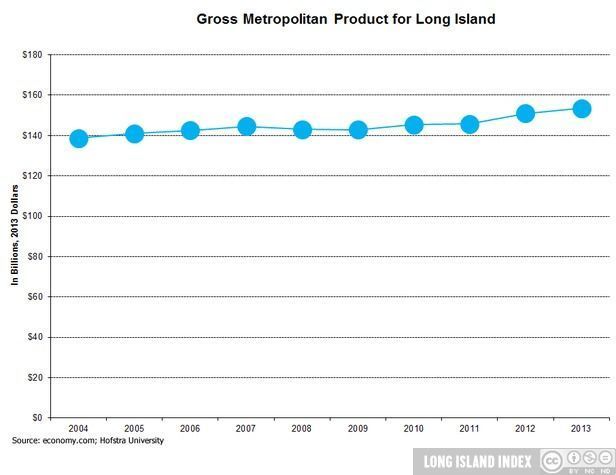
Gross Metropolitan Product
Long Island’s economy continues to show signs of growth since the recession. However, growth has lagged behind the U.S. GDP as a whole.
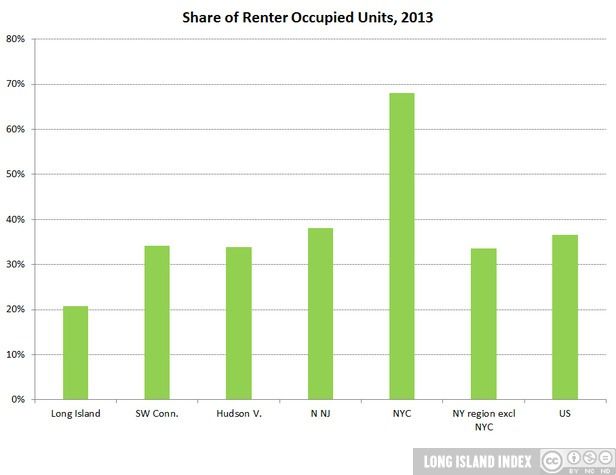
Share of Renter Occupied Units on LI Compared to Others, 2013
Share of renter occupied units on Long Island in comparison with other suburban communities, 2013
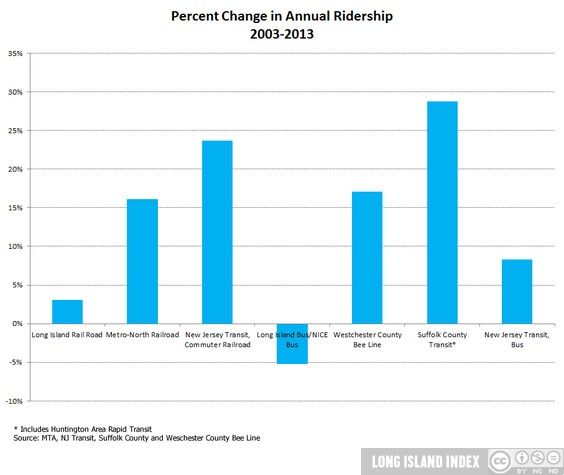
Percent Change in Ridership, 2012-2013
Percent Change in Ridership on the Long Island Rail Road and others, 2012-2013
Gross Metropolitan Product, 2004-2013
Long Island’s Gross Metropolitan Product, 2004-2013
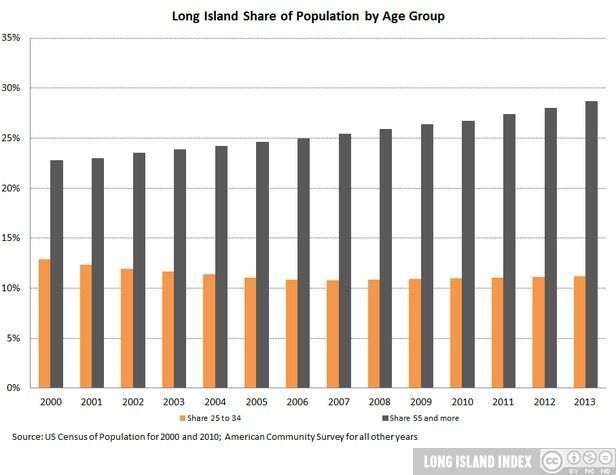
Share of Population by Age Group, 2000 – 2013
Share of population by age group on Long Island, 2000-2013
Median Home Sales Price, 2000-2013
Median home sales price on Long Island, 2000-2013
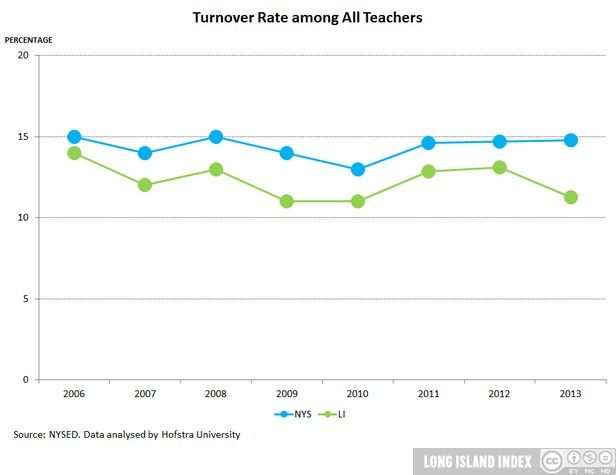
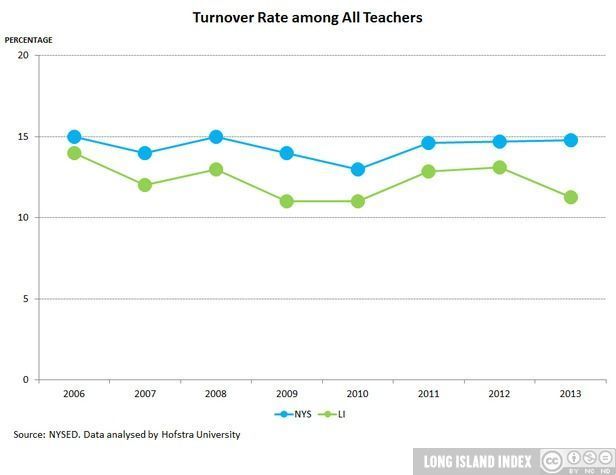
Teacher Turnover Rate LI & NYS, 2006-2013
Turnover rate among all teachers on Long Island & NYS, 2006-2013
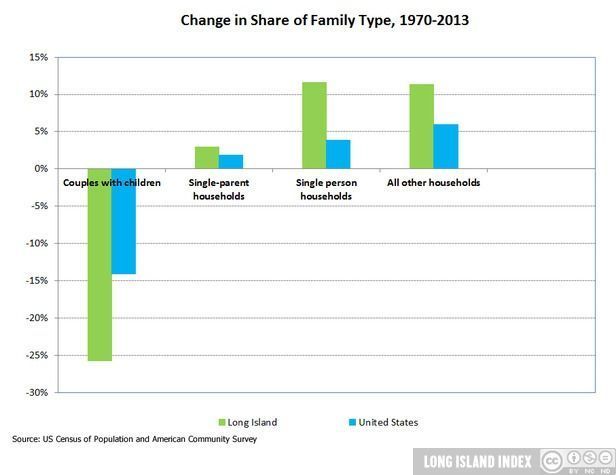
Change in Share of Family Type, 1970-2013
Change in share of family type on Long Island, 1970-2013